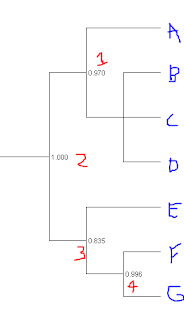
Okay, here is an example of what has me scratching my head. In the tree below, the software suggests that split #2 is essentially a lock. Split #4 also has strong evidence. But split 3 isn't in the same league.
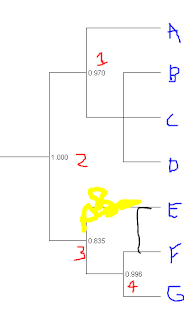
So, if you were explaining the meaning of this to someone not schooled in trees, what is the best way to do it? Is it that we can't rule out that alternative topologies that lump E with F (sketched below) or E with G are not yet excluded from the data?
That's what I think this means, but the nagging issue is that the cladogram visual is a bit at odds with this -- visually it looks like F & G going together is a slam dunk. But then that confidence value wouldn't make much sense -- F & G are always going to be split from each other! Is it correct to say that 99.6% of trees have F & G as nearest neighbors? If that were the case, then how does E fit into the puzzle.
I suppose in the end what is messing with me is the sandwiching of a poor value between two really good ones. If 99.6% of trees have FG as a group and 100% have EFG as a group, then how can 16.5% of them not have E separate from FG?
So, who is up to schooling me?
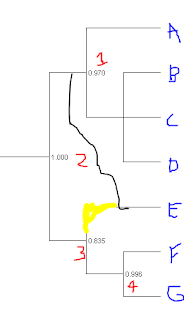
UPDATE: Based on comment from Roy below, then most of the alternative topologies probably look like this rather than the second picture above, correct?
For the record, the maximum likelihood values were generated by FastTree and the tree displayed with Dendroscope, from which I screen-captured and then scribbled on with Microsoft's Snipping Tool.
I think I'm still muddled on splits vs. branches -- in my head the only way to identify a branch is by the set of data it splits off. But I think this is progress.


3 comments:
It would be useful to know what methods/software you are using, as there's some guesswork involved otherwise. However, I think the key point is to think of bootstraps as being associated with "clustering" rather than "splitting". Despite how they are drawn in your figures, they are associated with branches, not nodes. They indicate what proportion of bootstrap replicate trees that branch exists in. So 99.6% of trees clustered F and G, but only 83.5% clustered E,F and G. Presumably, in most of the other replicates E was positioned on the other side of the root, outside of the ABCD cluster.
The way I think of it is to collapse poorly supported nodes, which would create a polytomy between A-D, E and F-G. That would mean that it's possible that E groups with A-D, but also possible that F-G groups with A-D (making E basal to all the other taxa).
HOWEVER, it is pretty unusual to have different bootstrap values on each side of the basal split like that. Most algorithms infer unrooted trees which can then be drawn with whatever root you like, and in a unrooted tree A-D vs E-G is a single bipartition, so it should have a single bootstrap value. I guess you must of used some rooted tree method...
To the best of my knowledge, the correct interpretation is - as said above - the fraction of bootstrap replicates which support the split of the subtree rooted at the child node of the branch from the rest of the tree.
Split 2 is meaningless without some indication of what outgroup determined the root. If there was no outgroup, then the value of 1.0 is some default assigned by the program so that all internal branches have bootstrap values.
Post a Comment